Here is another part of my work on memory analysis in Mozilla :
another-profiler_techno-barje.fr.xpi
This new version of "Another memory profiler" is now an effective tool, which
display a lot of information about all objects living in your Firefox instance!
By all I mean not only website javascript objects, but all objects
used by Firefox in its windows, sidebars, extensions, all tabs, iframes, etc.
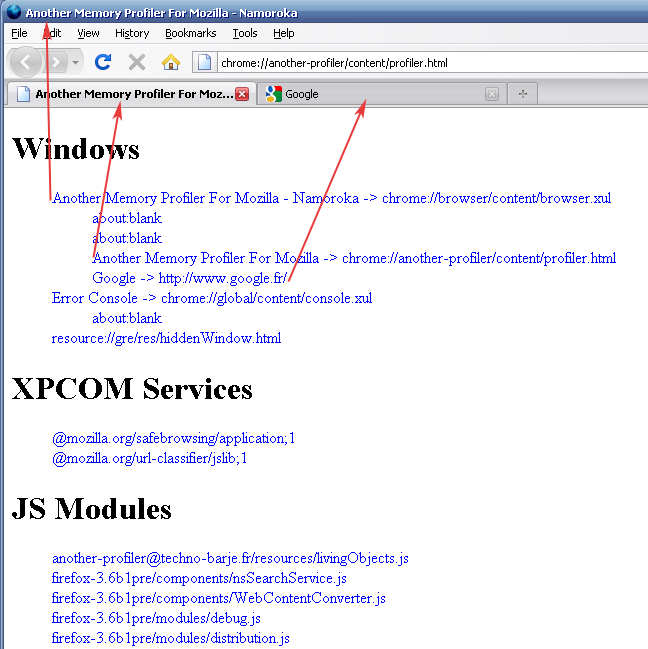
The previous version allowed you only to select one component : a DOM
window(website, sub-iframe or any XUL window), a XPCOM service or a JS Module
:

Now you can get a report about currently living objects : the ones that are
still used because there is at least one reference to each of them. This report
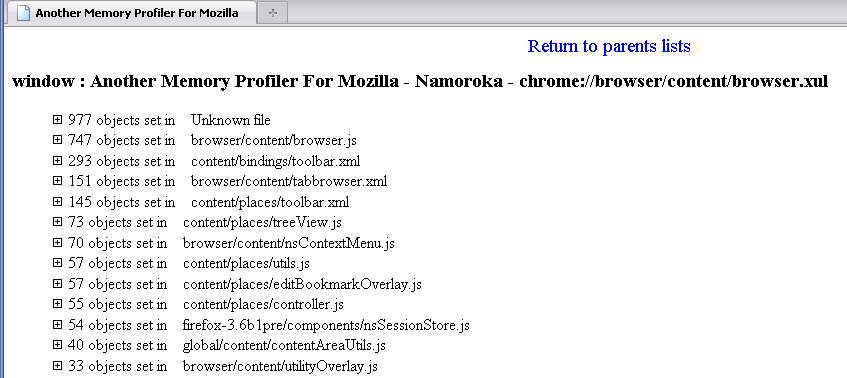
first display all javascript files involved in your component :

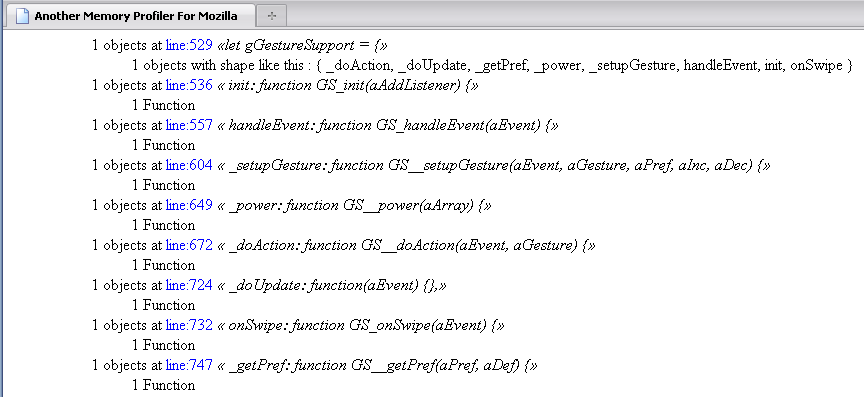
By selecting one file, you are seeing the number of living object sorted by
there instantiation line :

Finally, this tool display objects counts for each line sorted by there type. But Javascript is not a strongly typed language, so it’s not really easy to sort its objects by a type! That’s why there are several way to describe a JS object :
- Define a JS object by its attributes, like Atul Varma is doing in its current work,
- By its JS Prototype name, very usefull "typing" when you are using Prototype and build Object-Oriented JS,
- We are facing some specialized objects like all DOM objects : HTMLFormElement, HTMLDivElement, …
- And finally all native types, like Array, String, Date, RegExp, … etc.
Finally, let’s see how to make this extension work :
- First It contains a binary component which is only built for Firefox 3.5 and 3.6 for Windows and Linux-32.
- Secondly The memory profiling component is a patched version of the Mozilla Jetpack’s one, so take care to disable Jetpack, before testing this!
- Then In order to get the maximum information about your
living JS object, I strongly encourage you to set these two prefs to false :
javascript.options.jit.content = false
javascript.options.jit.chrome = false
(That’s because Tracemonkey optimise loops and seems to embed empty stack frame information on these loop’s execution …) - That being said, you just have to install this extension another-profiler_techno-barje.fr.xpi, go to your Tools menu and click on "Open another memory profiler".
Come back for the next post for some more explanation on displayed results with simple scripts examples.